The thought of combing through a monstrous spreadsheet of thousands of numbers makes most people queasy…
But at the risk of revealing my inner nerd… I find it soothing.
There is a plain truth in numbers. If you look to the mainstream news or even valued opinions from market experts, you just don’t get those same black-and-white answers.
And right now, there’s a question that everyone reading this likely wants the answer to: When will this stock market crack?
So, in today’s issue, I’ll lay out my case for the exact day the market will begin to correct again.
You’ll see how I got to the answer… and where we’re going next. And most importantly, I’ll show you what to do with your money when the moment arrives.
A Versatile System
If you know me, you know I’m an eternal optimist and perennial bull. But ultimately, I’m a slave to my data.
You see, most of my market research relies on an unbeatable stock-picking system I built over decades. It scans 5,500 stocks a day, ranking each one for fundamental health (things like earnings, sales, and profits) and technical factors (things like new highs, lows, or how strongly a stock is trading).
Then, I overlay a special algorithm designed to identify when big money is moving in and out of stocks. It spits out buy and sell signals on stocks that are seeing big money flows.
This process, of course, is how I pick my recommendations to Palm Beach Trader subscribers. And it’s led us to gains like…
-
953% on The Trade Desk (TTD)
-
428% on SolarEdge Technologies (SEDG)
-
313% on Paycom Software (PAYC)
-
And on and on…
But that’s not all my system does.
Each day, I take all the buy and sell signals of the 5,500 stocks and plot them on a 25-day moving average. The result is the Big Money Index (BMI) – which tracks the big money’s broad direction.
It looks like this:
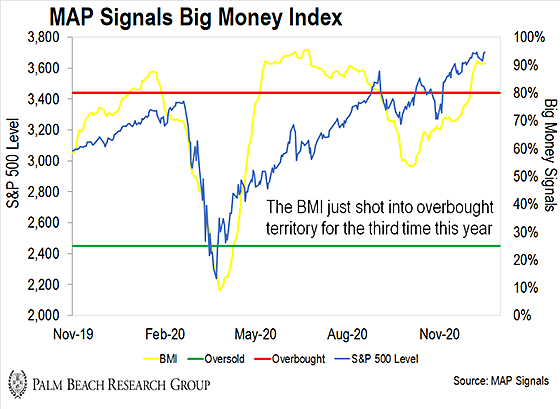
And the way it works is simple. When the yellow line drops below green line, the market is oversold and we can expect a big bounce in the near term.
When it’s above the red line, the market is overbought and we can expect a near-term pullback.
My data goes back to January 1, 1990. That’s 30 years, or 7,800 trading days. And each day has a BMI reading.
It’s been highly accurate for identifying market tops and bottoms for three decades. It’s what allowed me to alert readers in late January that a market top was near. It also allowed me to call a market bottom for March 20 (off by one day). My data told me to bet on America… and to tell you to buy stocks in late March and early April. (Anyone that listened is must be happy… The S&P 500 is up 65% since.)
But that was then, and this is now. And as you can see in the chart above, the stock market is heavily overbought right now…
And while overbought conditions can persist a long time, like we saw this summer… They don’t last forever.
So that begs the question: when will it crack?
The Data Points to This Specific Day
So what’s the data say is next for the market? The good news is I’ve done all the hard work and number crunching for you…
We can know where we’re going by looking at where we’ve been.
What’s important to know is that the BMI can stay overbought for a long time. It did so for four months this year – from May 6 to September 2.
The key is when the BMI peaks in overbought territory. That’s when we need to pay attention.
It often drifts lower as big-money buying disappears and selling increases. But stocks often continue to rise for some time thereafter. When the BMI peaks, it’s usually a good time to reduce risk, take profits, and save cash to go shopping when markets eventually do come under pressure.
So let’s put this all together:
-
There have been 52 overbought periods of the BMI since 1/1/1990.
-
The average length of each overbought period is 43 calendar days – about six weeks.
-
The BMI peaks an average of 19 days (just short of three weeks) after the market initially goes overbought.
-
The S&P 500 rose an average of +1.7% in that time.
-
The S&P 500 peaks an average of 46 days after the market initially goes overbought. That means stocks can rise for nearly four weeks after the BMI peaks!
-
The S&P 500 rose an average of +4.3% from the initial overbought reading to its peak. So when we see a gain like that after going overbought, that’s a sign to be cautious and get ready for the inevitable pending drop.
-
Once that drop finally begins, get this: the market peak-to-trough takes an average of 91 days – that’s a little more than three months!
-
The S&P 500 fell an average of -8.9% during those peak-to-trough drops.
So, we can not only summarize what history has told us, but we can forecast the precise dates and levels for the next overbought period. Let’s have a look:
| Stat | Date | Index Level | |
| Overbought Periods | 52 | ||
| Avg. # of Days | 43 | Wednesday, January 13, 2021 | |
| Avg. Days Until BMI Peak From Overbought | 19 | Monday, December 21, 2020 | |
| Avg. Days to Index Peak from Overbought | 46 | Monday, January 18. 2021 | |
| Days From Index Peak to Trough | 91 | Monday, April 19, 2021 | |
| Return from Overbought to BMI Peak | 1.7% | 3731.56 | |
| Return from Overbought to Market Peak | 4.3% | 3828.5 | |
| Return from BMI Peak to Market Peak | 2.6% | ||
| Return from Index Peak to Trough | -8.9% | 3341.81 |
Remember in the beginning when I mentioned most people cringe when thinking about crunching numbers?
Well, number crunching allows me to be pretty accurate when calling market tops and bottoms.
I used this same technique when I called a market bottom for Friday, March 20 of this year. (I was off by one day. The S&P 500 bottomed on Monday, March 23.)
So I will boldly go ahead and make the following predictions, based on my 30 years of data crunching, and using the averages we discussed above:
-
The market went overbought on December 2.
-
The market will remain overbought until January 13, 2021.
-
The BMI will peak on Monday, December 21, 2020, at an S&P 500 level of 3731.56.
-
The S&P 500 will peak on January 18, 2021, at a level of 3828.50.
-
The S&P 500 will then subsequently fall until Monday, April 19, when it will trough at 3341.81.
Of course, those are very precise figures. I’d be surprised if things play out in this exact way.
But one thing is for sure… history suggests a market peak is near. And 30 years of data tends not to lie.
Secret Weapon
This is why following big money has become such a big part of my investing strategy…
Big money can show us the way forward. It can let us know when to keep our chips on the table, and when to take them off.
Data may be boring to most people, but it’s my secret weapon for navigating markets. Some see a sea of unrelated numbers… but I see a market map.
And I’ll be keeping a close eye on it.
Patience and process!

|
Jason Bodner
Editor, Palm Beach Insider
P.S. I’m confident in the numbers I’ve forecasted for the near future. But I’m even more sure of my ability to profit from these upcoming conditions.
That’s because my unbeatable stock-picking system reflects my personal philosophy to investing… It relies on the hard data, tracking when the big money pours into stocks.
The Trade Desk, SolarEdge, and Paycom are not our only triple-digit winners. My Palm Beach Trader subscribers have also seen gains of 192% from Nvidia (NVDA) and 127% from Veeva Systems (VEEV).
The market will hit a trough soon, but there’s still massive gains to be made right around the corner. Just click here to learn more…