I’ve been saying it all along: Data allows our brains to block out the noise of emotions.
I know I sound like a broken record, but it’s true.
Whether it’s the coronavirus pandemic or the stock market, hard numbers snap everything into focus.
The data gives us context, while filtering out panic and the unnecessary media chaos.
And that’s why I spent nearly a decade and hundreds of thousands of dollars to develop my “unbeatable” stock-picking system.
It not only helps me look at the numbers for individual stocks… it puts the entire market, sectors, and trends in perspective, too.
And so far, its data has been very timely, accurate, and helpful for us during this overall sell-off.
So today, I want to show you nine times it tuned out extraneous news and predicted the market’s movements during this pandemic sell-off. It’ll reveal just how powerful my system is.
But first…
Our Market Timing Indicator
As you know, my system tracks the big money’s buying and selling movements.
I used my experience from nearly two decades at prestigious Wall Street firms – regularly trading more than $1 billion worth of stock for major clients – to make sure it’s highly accurate, comprehensive, and effective.
My system scans nearly 5,500 stocks every day, using algorithms to rank each one for strength. And when it sees big-money investors piling into or getting out of a high-quality stock, it raises a yellow flag.
I put these yellow flags through another filter. If the flag turns red, it means the big money is selling. If it turns green, it means the big money is buying…
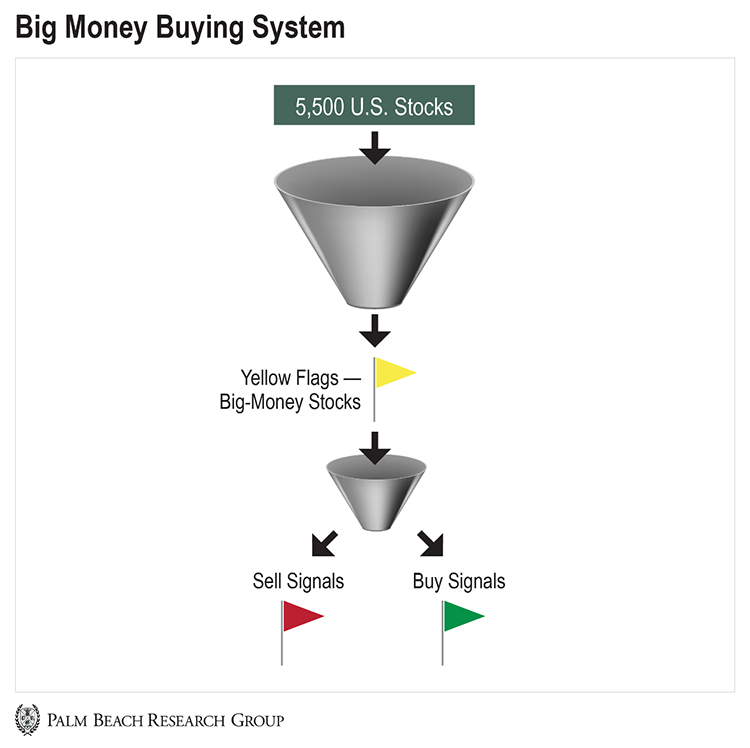
It’s that simple.
This is the data that powers the Big Money Index (BMI). It indicates whether the markets are overbought or oversold (seeing extreme buying or extreme selling).
And so far, our market timing indicator has been spot-on…
Thanks to the Data, I Was Right…
Today, I wanted to look back and show you how the numbers have accurately mapped out the market’s moves during this massive pullback.
Just take a look at this chart of the S&P 500 over the last few months…

I’ve numbered the exact points where my system predicted key big-money movements:
-
“Expect a Market Pullback Soon,” January 17: Big-money buying started slowing after the market hit overbought levels. I warned a pullback was coming and advised us to have cash on hand and our shopping lists ready.
-
“Investors Should Continue Buying High-Quality Stocks,” February 19: After a short-term pullback… the data said the overall market trend was still headed up, but more zigzags were ahead.
-
“Investors Seeking Safety Amid Coronavirus Fears,” February 26: We saw the first waves of big-money selling pick up. So I told you to embrace the volatility because it would hand us stocks on sale soon.
-
“Lower Interest Rates Will Boost the Markets,” March 4: I told you my system’s historical data showed market sell-offs last about three weeks on average. So it was predicting a bottom around the third week of March.
-
“Investors Should Buy the Dips, Not the Rips,” March 11: My system predicted the market bottom would be on Friday, March 20. (And it was only one trading day off. The market ended up bottoming on Monday, March 23.)
-
“Stocks Are in Oversold Territory,” March 23: The system indicated oversold market conditions on March 18. And while waiting for the inevitable rebound, I advised bargain-hunting for quality stocks.
-
“Stocks Will Be Up by Double Digits Within a Year,” March 30: We hit record oversold levels, with the BMI hitting 9%. Since the market is forward-thinking, Wall Street had already finished pricing in the effects of the coronavirus pandemic. So I said we’d see higher prices ahead as it started anticipating the effects of market stimulus.
-
“The Market Is Seeing a Short-Term Bottom,” April 6: The system indicated the largest-scale selling (through hedge fund liquidations) had passed us. Buying was trickling in again, and it was time to take advantage of the Great Reset.
-
“The Market’s Conditions Are Improving,” April 13: The data showed the market was emerging from oversold conditions due to improving investor sentiment and volatility. So stocks were finally starting to rebuild a solid base.
As you can see, thanks to my system, we had an accurate “real-time” model of market movements. All we had to do was listen to the numbers and ignore our emotions and negative news.
The bottom line: We can accurately predict the future based on proper data analysis.
So what’s the data saying today?
These Sectors Are Leading the Market Rebound
Again, the market is no longer oversold. Volatility is continuing to settle. Stocks are finding a new base again.
And we’re seeing certain sectors emerge as leaders.
Remember, the Global Industry Classification Standard (GICS) sorts the 11 sectors making up the S&P 500. Each sector is broken down by industry group, industry, and sub-industry.
And the table below ranks the 11 GICS sectors based on their strength, as measured by my system. The higher the number, the more buying the sector is seeing – and the stronger it is…
| Sector | Strength Ranking |
| Information Technology | 62.5 |
| Health Care | 61.2 |
| Consumer Staples | 58.4 |
| Utilities | 55.5 |
| Consumer Discretionary | 53.2 |
| Industrials | 52.3 |
| Materials | 50.7 |
| Real Estate | 49.3 |
| Communication Services | 47.8 |
| Financials | 47.5 |
| Energy | 47.2 |
As you can see, information technology and health care stocks are paving the way.
And it makes sense the big money is interested in these sectors right now…
Many people are working from home, increasing the need for telecommuting and cloud computing. Others are using streaming services to pass their time. And this all ramps up network demand – including for the buildout of 5G technology.
Meanwhile, health care stocks are seeing big interest due to the medical community’s overloaded need for services and equipment. There’s also the research and development of possible treatments and vaccination for the coronavirus.
Now, there’s still plenty of uncertainty surrounding the pandemic. So we’ll continue to see volatility and zigzags in prices.
But earnings season is underway, and overall, stocks have been rebounding from the March 23 bottom. Wall Street is betting on optimism and eventual economic recovery.
And the data – which has been spot-on so far – agrees that we should, too.
Patience and process!

Jason Bodner
Editor, Palm Beach Insider
P.S. My system has been correctly forecasting the market’s moves for months. And right now, it’s saying infotech and health care stocks are leading the way in this rebound.
If you want broad exposure to these sectors, consider buying the Invesco QQQ (QQQ) exchange-traded fund. It holds 53 top infotech and health care stocks.
But to truly profit from this recovery, you have to target the stocks that bounce back even higher than the broad market – like tennis balls.
And my system can help you find them. In fact, it’s helped subscribers to my Palm Beach Trader service see gains of over 47% on one life sciences software stock in the past month alone.
To learn how you can join them, just watch this special presentation on my system right here.