Humans are often tricked into believing that everything we see is all that’s actually there.
Take the electromagnetic spectrum, for example. It’s the entire range of light that exists – from cosmic rays to broadcast bands.
But here’s the thing…
Most of the light in the universe is, in fact, invisible to us. Scientists estimate we can see only 0.0035% of the electromagnetic spectrum – the tiny sliver between ultraviolet and infrared…
 Source: National High Magnetic Field Laboratory
That means we can’t see more than 99.9% of what’s out there.
And the same is true of the markets.
You see, big institutional money accounts for about 70% of all trading volume every single day. But it goes on beneath the surface – and unnoticed by most investors.
And that’s how I see the market. I focus on these “invisible” money waves. So today, I’ll reveal what they’re telling me…
The Big Money Beneath the Market
Last Friday, I held a special presentation for The MoneyShow’s June Virtual Event.
During my speech, I explained how I see the world of stocks differently than most analysts…
Stocks float on a sea of big money, the same way the Earth’s crust floats on magma. But we generally don’t notice magma until it blasts out of a volcano.
The big money works the same way. You don’t see it until it bubbles up and rockets stocks much higher. But by then, it’s too late to profit.
The chart below shows the fluid waves of big money underneath the market…

As the big money moves in and out of stocks, we need to pay attention to the troughs and crests of its volume.
When selling hits extremes (oversold markets), bottoms are near. When buying hits extremes (overbought markets), tops are often near.
We’ve been in severely overbought conditions since May 6. That’s why I’ve been calling for a short-term sell-off over the last month – because the top has been forming.
Now, we’re finally starting to see the beginning of the pullback.
For instance, stocks just suffered their worst week since the March lows. The major indexes were down an average of 5.2%. And based on my data, I expect a sell-off to last a while longer…
More Selling Ahead
Remember, I created my “unbeatable” stock-picking system to track these big-money waves and take emotions out of investing. It scans nearly 5,500 stocks every day, using algorithms to rank each one for strength.
But it also looks for the buying and selling movements of big-money investors in the broad market through its market timing indicator – the Big-Money Index (BMI)…
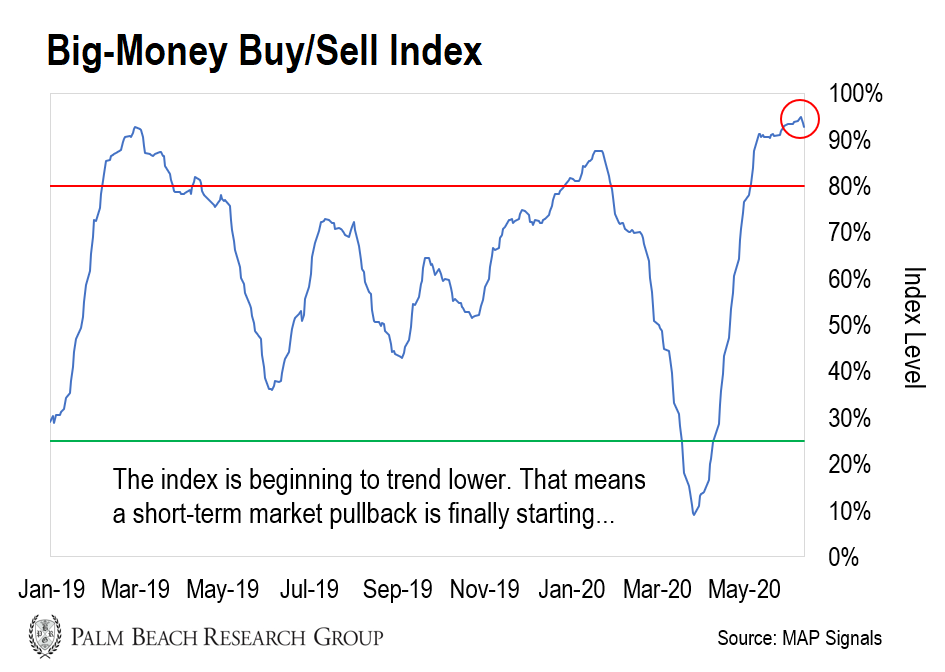
Now, when the index hits 80% (see the red line above) or more, it means buyers are in control and markets are overbought. And when it dips to 25% (the green line) or lower, sellers have taken the reins, leading the markets into oversold territory.
While we’re still in overbought conditions, the BMI’s decline signals that the market has more downside ahead in the near term.
In fact, just take a look at the table below. It shows the percentage of stocks in each sector seeing big-money buying for the trading weeks ending on June 5 and June 12, respectively:
|
Sector |
Big-Money Buy Signals Through June 5 |
Big-Money Buy Signals Through June 12 |
|
Technology |
88% |
27% |
|
Discretionary |
134% |
47% |
|
Industrials |
120% |
42% |
|
Staples |
55% |
35% |
|
Healthcare |
39% |
14% |
|
Materials |
131% |
32% |
|
Financials |
116% |
47% |
|
Communications |
33% |
32% |
|
Real Estate |
106% |
60% |
|
Utilities |
33% |
26% |
|
Energy |
73% |
61% |
As you can see, there’s been a decline in buying across all sectors. And we want to wait for this selling to exhaust itself so we can buy into the next market trough.
There may be some day-to-day volatility until then. But in the meantime, we’ll stick to our win-win game plan of staying calm – and having our shopping lists ready to pick up high-quality stocks on sale.
Patience and process!

|
Jason Bodner
Editor, Palm Beach Insider
P.S. My system is already targeting some potentially mouth-watering deals coming along – specifically in the discretionary, technology, and healthcare sectors.
We’re just waiting for my system’s green light to start shopping again. As you know, timing is everything.
And to find out which stocks my system is flagging for our shopping list, just check out all the details right here.