My mom’s biggest lesson for me when I was learning to drive was: “Never mess with a truck or a bus!” In other words, if you’re driving a car, you don’t want to fight the big guys.
The same rings true for the market. To make profits, you can’t fight the big money… You have to follow it instead.
Now, most people have no clue what the big boys are doing until it shows up on CNBC. But by then, it’s too late. The major moves have already been made.
But wouldn’t it be nice to get a heads-up on these big-money movements before they actually happen?
Consider this… We all know what to do on the roads when we see a traffic light. If it’s green, we go. If it’s yellow, we slow down. And if it’s red, we stop.
Well, what if the market had its own “traffic light” signaling the big money’s actions?
The good news is, it does. But it’s not easy to see. That’s why I’ve dedicated my life to helping you spot it.
And today, I’ll reveal what it’s signaling today – and what it means for our game plan…
Our Stock Market Traffic Light
Remember, I spent nearly a decade and hundreds of thousands of dollars developing an “unbeatable” stock-picking system that follows the big money’s movements.
And I used my experience from nearly two decades at prestigious Wall Street firms – regularly trading more than $1 billion worth of stock for major clients – to make sure it’s highly accurate, comprehensive, and effective.
It scans nearly 5,500 stocks each day, using algorithms to rank each one for strength. But it does more than just look at individual stocks. It also looks at the big-money buying and selling in the broad market.
This is the data powering my system’s Big Money Index (BMI). And the BMI is so accurate that it’s forecasted over a dozen market moves during this year’s sell-off. That includes the market’s bottom in March, almost to the day… and the rebound.
Now, today, I want you to visualize the BMI a little differently than usual. I want you to think of it as our market traffic light. And right now, it’s flashing red…
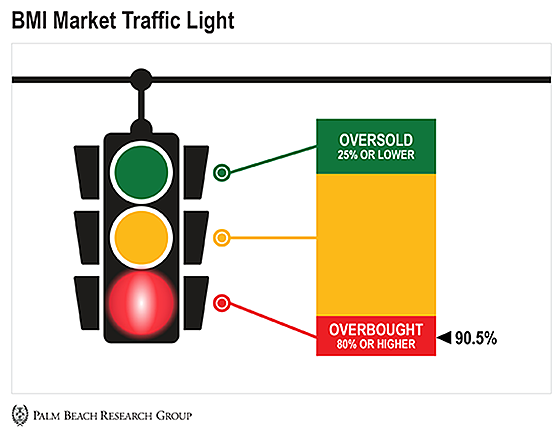
As you know, when the index dips to 25% or lower, sellers have taken the reins, leading the markets into oversold territory. That’s our signal to start aggressively buying stocks.
And when it hits 80% or more, it means buyers are in control and markets are overbought.
It’s simple… Green means buy. Yellow means to be patient when buying. But red doesn’t mean sell. It simply means stop buying.
So at 90.5%, we’re very overbought. But if you’ve been reading Palm Beach Insider lately, you know that doesn’t mean to run and sell all your stocks.
Overbought conditions can stay overbought for a long time, as we saw this summer when the BMI stayed overbought for nearly four months.
The bottom line is: This red light is telling us to stop buying stocks for right now and stay patient. And we don’t want to go against it.
But when should you look to start selling?
Don’t Go Against the Big Money
Even though we’ve reached overbought conditions once again, those conditions could last a while.
Right now, my data suggests that the BMI will peak on or around January 6, 2021. If we see it start to retract back to neutral conditions, that will be our signal to start taking profits.
But the best thing about my unbeatable stock-picking system is that it ALWAYS finds opportunity in outlier stocks. The stocks that start small, attract big money, and eventually go on to become household names.
You see, outliers exist in all market conditions. As long as you target these “tennis-ball” stocks – the ones that’ll rally even higher than the broad market during this volatility – the wait for profits will be worth it.
In the meantime, we’ll continue to follow our big-money “traffic light” and patiently look for prices we like when adding stocks.
We’ll be able to ride our winners, while we keep cash on hand to pick up high-quality stocks on sale.
So no matter what, we’ll execute our game plan…
Patience and process!

|
Jason Bodner
Editor, Palm Beach Insider